Meter

The Meter sink performs various measurements on the source's data. The measurement values can be displayed in segment displays (default) as well as gauge displays. Appearance of the meter can be configured in the program settings.
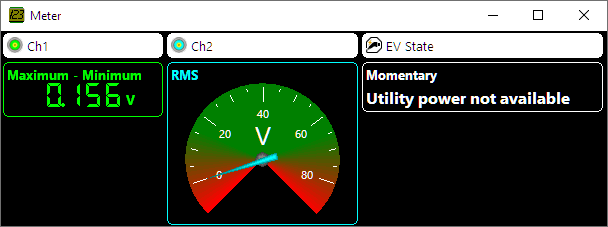
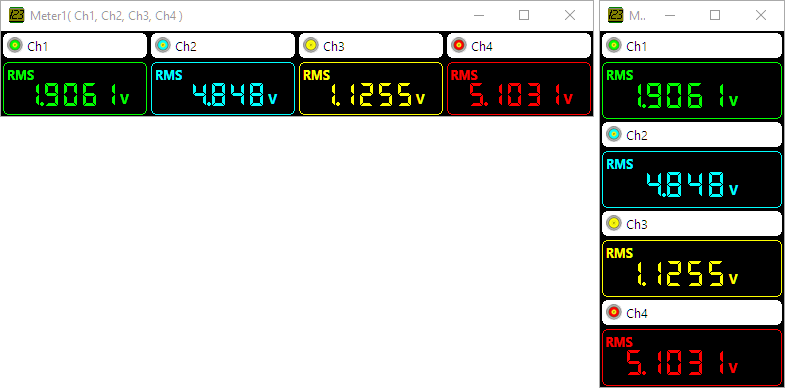
Multiple sources can be connected to the meter and per source, multiple measurements can be displayed, in individual displays. Sources with time domain data and sources with frequency domain data can be connected to a meter. For each connected source, a column with displays is added to the meter window, a caption at the top of the column indicates the source by its icon and name or alias. Clicking that caption will open the settings window of that column's source. Right-clicking the caption will open a popup menu with additional actions and settings for the column.
Connecting a source can be done in two ways:
- drag the source onto the Meter in the object screen
- drag the source onto the window of the Meter
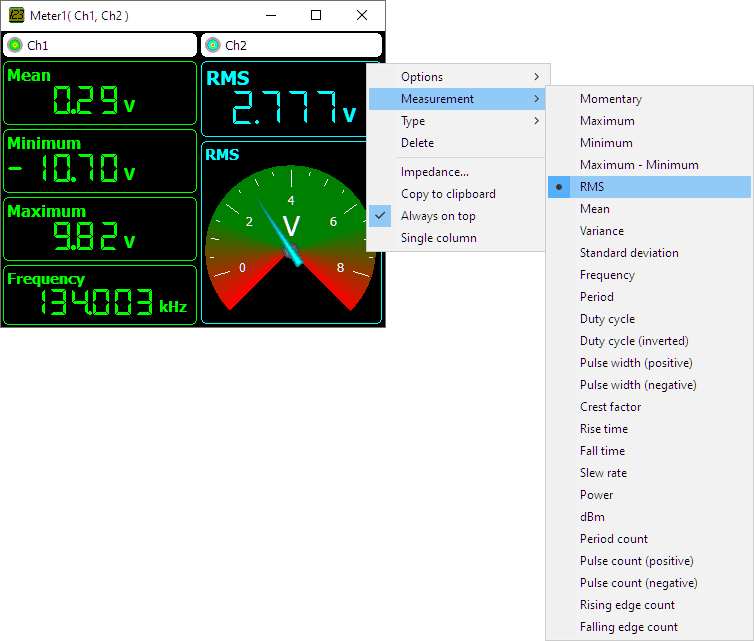
The following measurements are available:
- Momentary
- Maximum
- Minimum
- Maximum-Minimum
- Root Mean Square (RMS)
- Mean
- Variance
- Standard Deviation
- Frequency
- Period
- Duty cycle
- Duty cycle (inverted)
- Pulse width (positive)
- Pulse width (negative)
- Crest factor
- Rise time
- Fall time
- Slew rate
- Power
- dBm
- Period count
- Pulse count (positive)
- Pulse count (negative)
- Rising edge count
- Falling edge count
- Total Harmonic Distortion (THD)
The measurements are performed over the selected Measurement data range of the associated source. In the program settings can be determined which measurements are default shown when creating a meter.
Settings for the meter are divided in three categories:
Clipping detection
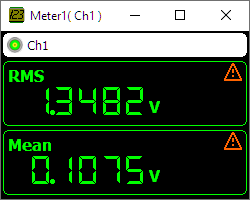
When clipping detection is enabled in the settings, the software will place indicators in the graph and/or meter display when the signal is clipped due to being larger than the input range.
When the displayed signal is processed by one or more I/Os, it may be no longer possible to detect whether the signal is clipped or not. In that case no indicators are shown.
The color of the clipping indicator can be determined in the settings.
Meter display properties and actions
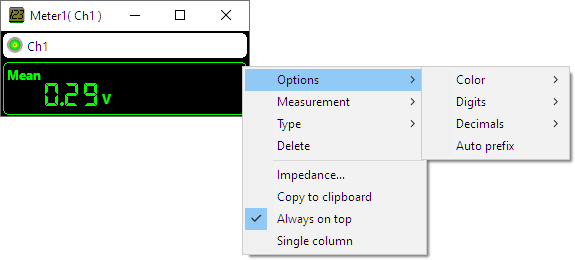
To control the behavior of a display of the Meter, several properties are available. These can be accessed through a popup menu which is shown when the display is right clicked.
Color
When multiple sources are displayed in a meter, they can be distinguished from each other by their Color. Two color settings are available for a meter display.
-
As source
The display will use the same color as its source. -
User defined...
The color of the display is user selected, using a color picker dialog. Any color can be used.
Digits
The Digits option determines how many digits are used to show the value on the segment display. Three different options are available:
-
Auto detect
The segment display determines the optimal number of digits, based on the resolution of the value. -
6
The segment display uses six digits to display the value -
User defined...
The number of digits is user defined, using a number input dialog.
Decimals
The Decimals option determines how many decimal positions are used to show the value on the segment display. Three different options are available:
-
Auto detect
The segment display determines the optimal number of decimals, based on the resolution of the value. -
3
The segment display uses three decimals to display the value -
User defined...
The number of decimals is user defined, using a number input dialog.
Auto Prefix
The option Auto prefix determines whether a prefix (µ m k M G etc.) is added to the displayed unit on a segment display. The displayed value is shown accordingly. Auto prefix is default on. When Digits and Decimals are set to Auto detect, Auto prefix will be fixed to on.
Range
The Range option determines the full scale range of a gauge display. Two options are available:
-
Auto ranging
The gauge display sets the full scale range according to the output range of the associated source of the display. -
User defined...
The upper and lower limit of the gauge display range are user defined, using an input dialog.
Measurement
The property Measurement determines which measurement is performed on the data of the associated source of the display. A submenu allows to select from the available measurements.
Type
The property Type determines whether a Segment display with numbers, a Gauge display with a pointer or a Text display is used to show the value. When a Text display is selected, the measurement for that display is automatically set to Momentary.
Delete
The Delete action deletes the display.
Meter column actions
Some actions that are related to a column of a meter are available. These can be accessed through a popup menu which is shown when the column caption is right clicked.
Add Measurement
The action Add measurement adds a display with a specified measurement to the column of displays for the associated source. The measurement to add can be selected from a sub menu.
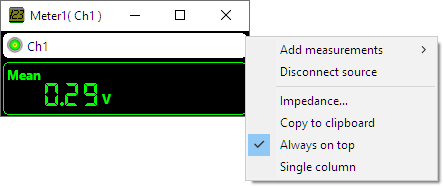
Disconnect source
To remove a source from a meter, the Disconnect source action can be used. This will remove all displays and caption for that source from the meter window.
Meter properties and actions
To control the behavior of the Meter sink, several properties are available. These can be accessed through a popup menu which is shown when the sink is right clicked in the object screen.
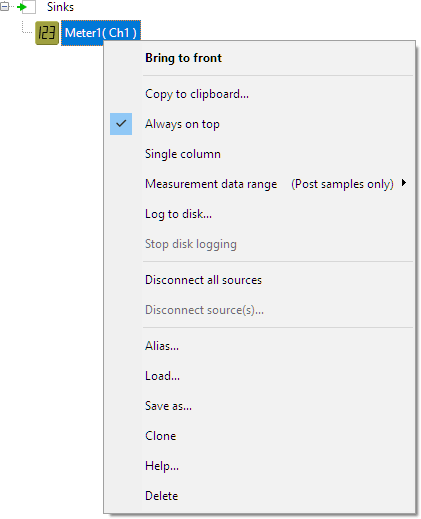
Copy to clipboard
The Copy to clipboard action copies the values of all displays including layout to the Windows clipboard, from where it can be pasted in various applications. The Copy to clipboard action is available in the popup menu.
Always on top
When the Always on top property is switched on, the Meter window cannot be hidden under other windows of the Multi Channel oscilloscope software. The Always on top property is available in the popup menu.
Single column
When measurements for multiple sources are displayed in the Meter sink, each source gets its own column with displays. When many sources are connected, the total Meter display can become very wide. In that case it can be more convenient to set the Meter to Single column, where all sources are shown in a single column, below each other.
Measurement data range
The data range over which the measurements are calculated can be set to one of the following settings:
- All samples: Use both pre samples and post samples to perform the measurements calculations.
- Post samples only: Use only the post samples to perform the measurements calculations. (Default)
- Pre samples only: Use only the pre samples to perform the measurements calculations.
Log to disk
The meter can log its readings to a Comma Separated Values file to disk. When enabled, a dialog is shown in which the destination folder for the CSV files can be selected. A separate file for each connected source, with date and time stamp of the starting moment of the measurement as file name, as well as the source's name.
Each line in the file will contain a time stamp and the values of the different displays for that source, separated by commas. Each time the meter gets new data, a new line is added to the file(s).
Stop disk logging
When disk logging is no longer required, Stop disk logging is used to close the created file(s) and make them accessible to other applications.
Common properties and actions
Related information

RPM
The RPM I/O converts a crankshaft signal into revolutions per minute.
EV charger control pilot analyzer
The EV Charger Control Pilot Analyzer I/O decodes the Control Pilot signal and shows the maximum available charge current and the charge status.
J1939 decoder
The J1939 decoder I/O extracts SAE J1939 SPN values from CAN messages.